Gitea Act Runner is the execution component of Gitea Actions, responsible for fetching CI/CD tasks from the Gitea Server and reporting execution results. As more teams self-host Gitea, the HTTP request volume between Runners and the Server has become a bottleneck on the Server side. This article documents how we analyzed and resolved this problem, reducing the request volume from approximately 1,300 req/s to approximately 170 req/s for 200 Runners — an 87% reduction.
Update (2026-04-20): This article originally described the design after PR #819 merged. A follow-up, PR #822, revealed during code review that #819 had introduced a concurrency regression for Runners with
capacity > 1, and addressed it with a “single poller + semaphore” architecture. See the new section at the end: Follow-up: Single Poller with Semaphore (PR #822).
Current Architecture: Everything is HTTP Polling
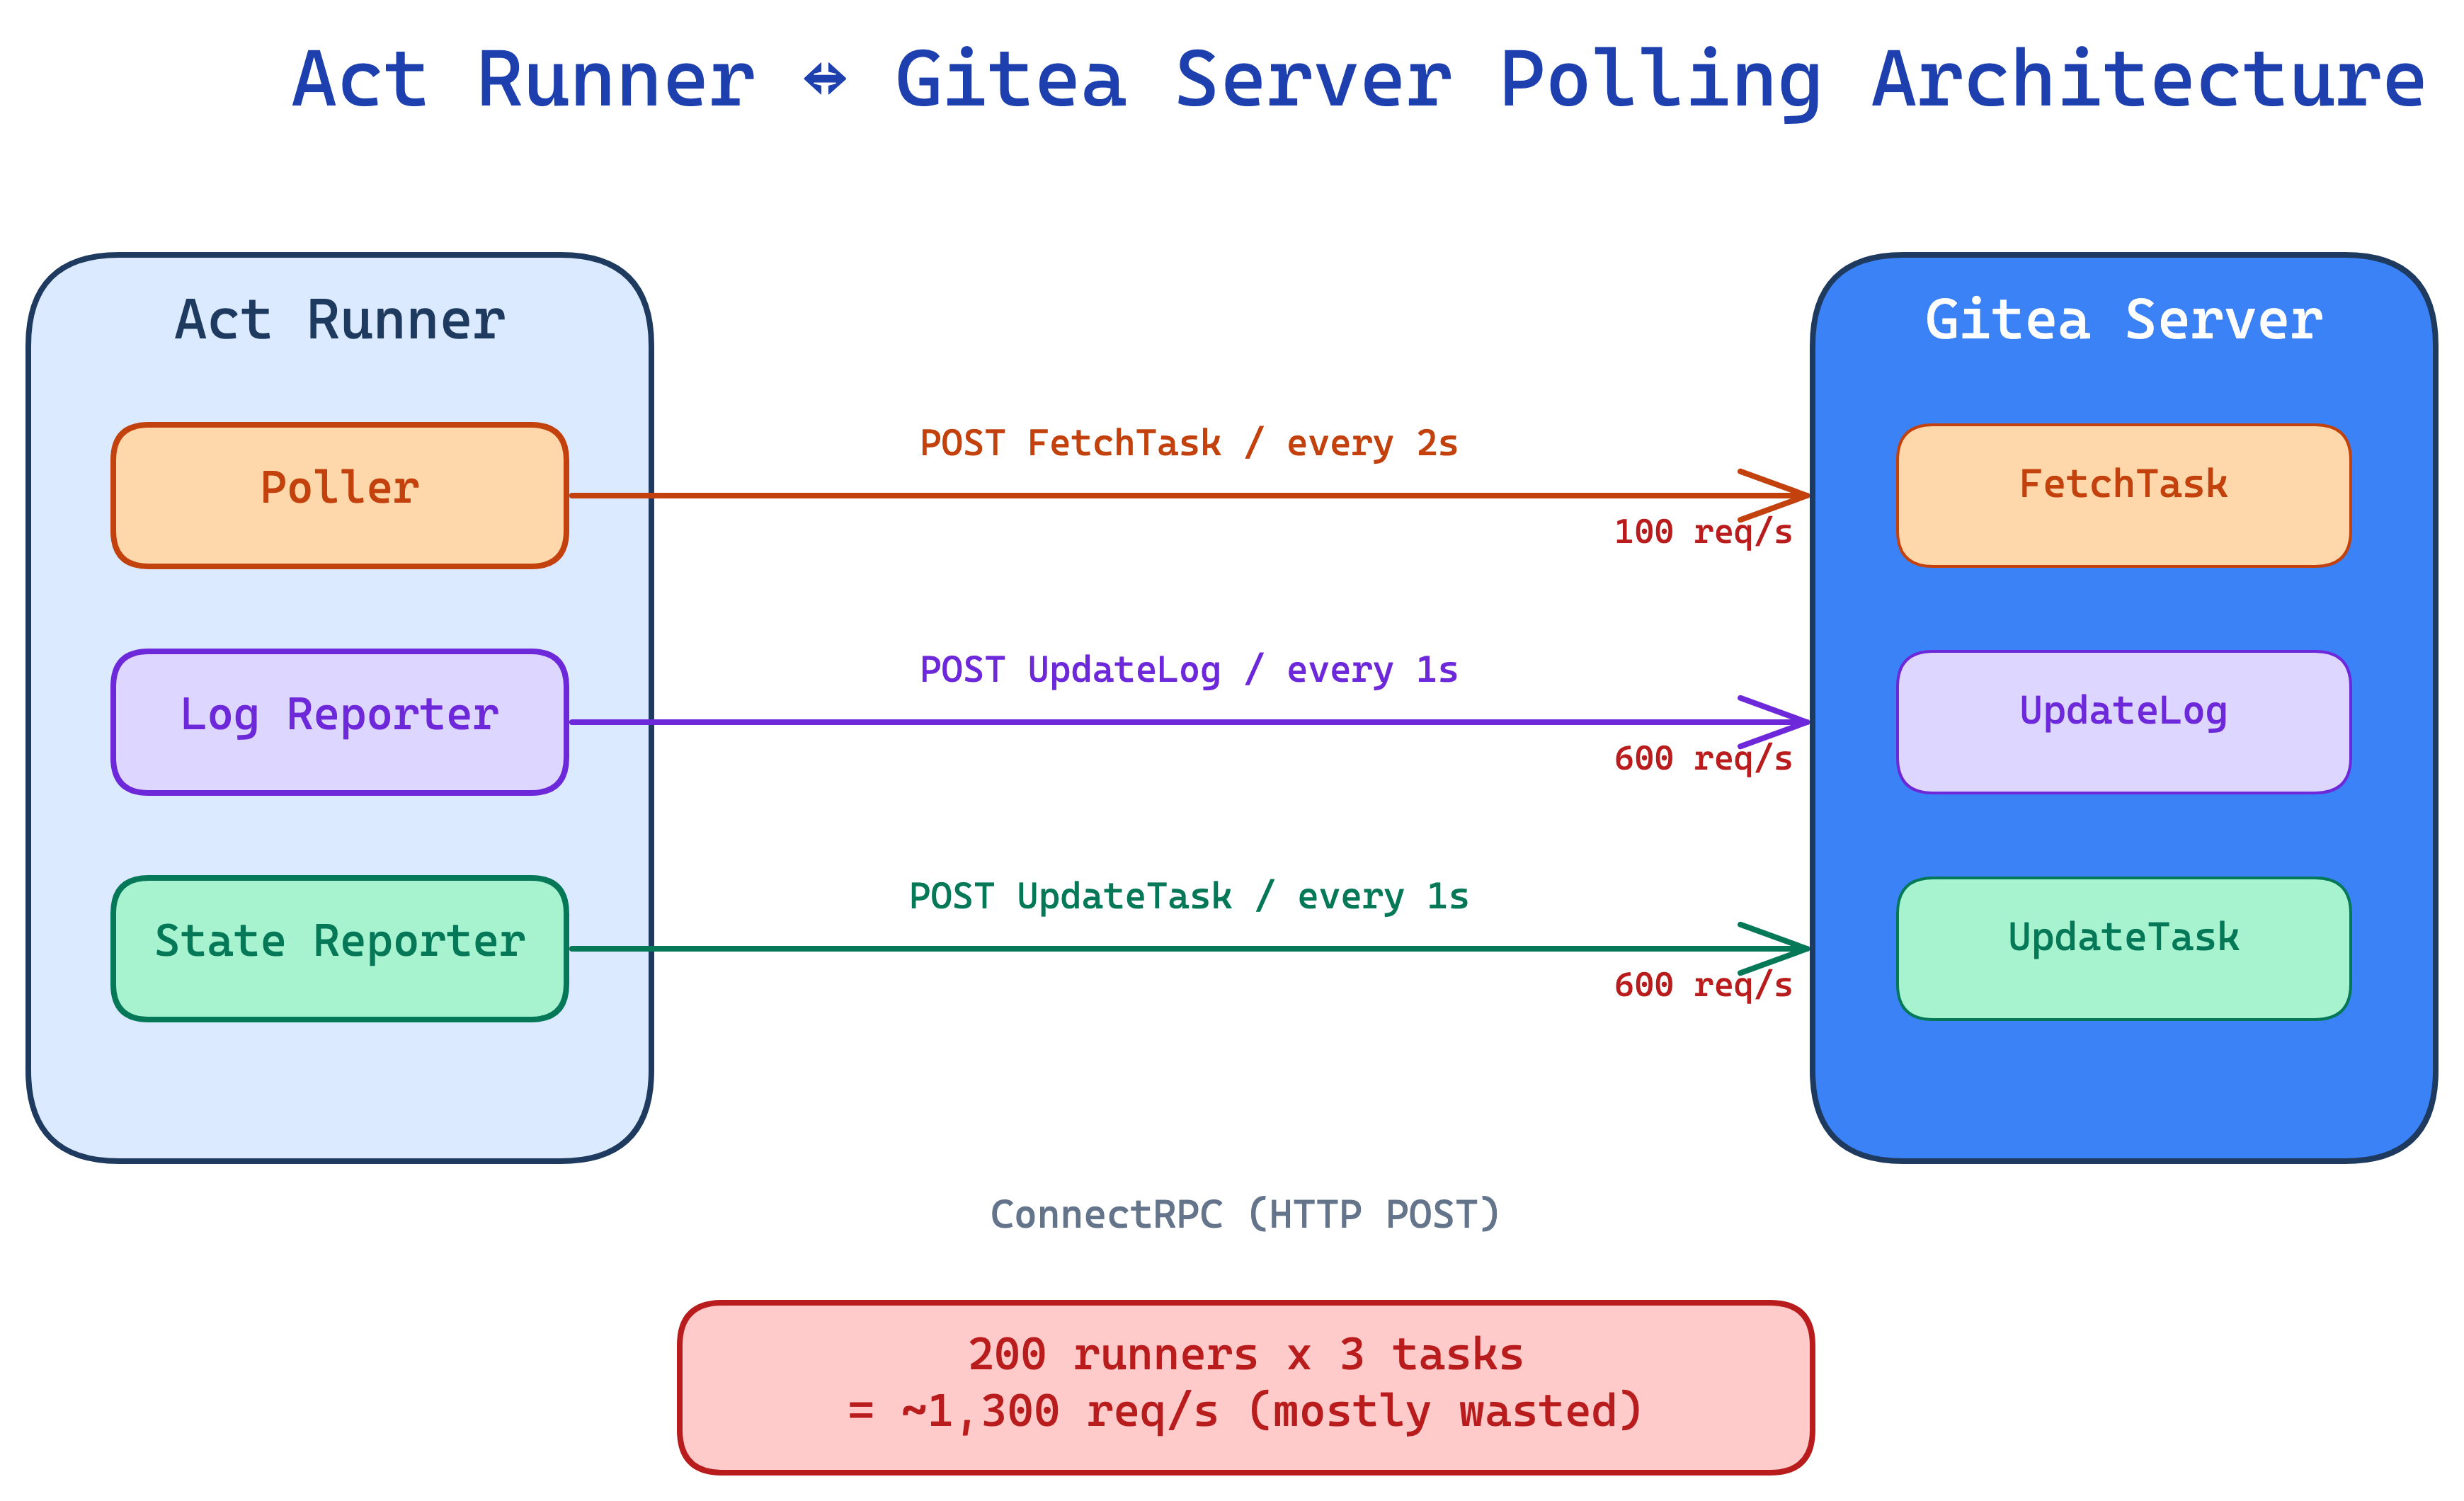
All communication between Act Runner and Gitea Server is based on ConnectRPC (HTTP unary request-response) — no streaming, no WebSocket. Every communication is a full HTTP roundtrip:
The original design had two fixed-frequency timers:
- Poller: Calls
FetchTaskevery 2 seconds, regardless of whether there are jobs - Reporter: Calls
UpdateLog+UpdateTaskevery 1 second, regardless of whether there is new data
Quantifying the Problem
Let’s calculate for a typical medium-to-large deployment: 200 Runners, averaging 3 tasks each.
Polling layer:
| |
Reporter layer (2 requests per second for each running task):
| |
Total: approximately 1,300 req/s. Most of these are wasted requests — no new jobs, no new logs, no state changes.
Solution 1: Polling Backoff with Jitter
The Polling Problem
200 idle Runners sending FetchTask every 2 seconds generate 100 req/s of wasted traffic. Worse, if the Server goes down briefly and recovers, all Runners will flood in simultaneously (thundering herd).
Design: Two Independent Counters (Per-Worker)
| |
Why not use a single counter? Because “no jobs available” and “Server is down” are two different scenarios requiring different recovery strategies:
| Scenario | empty | errors | Behavior |
|---|---|---|---|
| Server normal, no jobs | +1 | reset | Gradual backoff |
| Server unresponsive | no change | +1 | Aggressive backoff |
| Server recovers, still no jobs | +1 | reset | errors reset but empty maintains backoff |
| Task acquired | reset | reset | Immediately return to minimum interval |
Key scenario: Server goes down for 5 minutes then recovers. With a single counter, the first successful response after recovery would reset the counter to zero, and all Runners would simultaneously return to 2-second intervals, causing a thundering herd. With two counters, errors reset but empty continues, providing a smooth backoff transition.
Why per-worker instead of a shared atomic? Act Runner’s architecture consists of “N independent workers, each polling and running on its own” (Capacity controls N). With a shared counter, 3 workers each experiencing their first empty would push the counter to 3, being misjudged as “3 consecutive empties” and triggering a long backoff — when each worker has only been empty once. By splitting counters into workerState, each goroutine reads and writes its own int64, eliminating the need for atomics and avoiding this false backoff issue. An added benefit: when the Server recovers and one worker gets a task, only that worker’s backoff resets while others maintain their current interval, providing stronger thundering herd protection.
⚠️ Correction in hindsight: The argument above only considers correctness of the backoff counters — it misses the cross-worker polling rate. The old
rate.NewLimiter(rate.Every(FetchInterval), 1)withburst=1was actually shared across all N goroutines, which effectively serialized theirFetchTaskcalls. That implicit serialization was removed as a side effect of this change: a Runner withcapacity=60went from “1 FetchTask / interval” to “60 FetchTask / interval”, a regression for any deployment withcapacity > 1. See the new section at the end: Follow-up: Single Poller with Semaphore (PR #822).
The Math Behind Exponential Backoff
| |
Backoff curve:
min(n-1, 5) limits the bit shift because if n accumulates beyond 64, 1<<63 would overflow to a negative number.
Jitter: Spreading Synchronized Requests
If 200 Runners start simultaneously, their backoff counters will be identical, producing the exact same interval. Adding ±20% random jitter spreads requests across the [interval×0.8, interval×1.2] range.
Why 20% instead of 50%? Too much jitter makes behavior unpredictable (user sets 5s but actual could be 2.5s or 7.5s). 20% provides sufficient spreading without deviating too far from expectations. This is also the jitter strategy recommended by AWS.
Why We Abandoned rate.Limiter
The original design used golang.org/x/time/rate.Limiter:
The problem is that rate.Limiter has a fixed rate once created — it doesn’t support dynamically adjusting intervals or jitter. Switching to time.NewTimer with recalculated intervals each time naturally supports dynamic backoff.
Fetch First, Sleep After
An easy-to-miss detail: the old rate.NewLimiter(..., 1) with burst=1 allowed the first Wait() to return immediately, so the Runner could attempt to fetch the next job right after startup or completing a task.
When we initially switched to timer-based, we made a mistake — putting the sleep before the fetch:
The correct approach is fetch first, sleep after — attempt to fetch first, only sleep if nothing is available:
| |
This preserves the burst=1 semantics: fetch immediately on startup, and immediately try the next one after a task completes, without wasting any wait time.
Polling Results
| Scenario | Before | After |
|---|---|---|
| 200 idle Runners | 100 req/s | ~3.4 req/s (backoff to 60s) |
| Reduction | — | 97% |
Solution 2: Event-Driven Reporter
The Reporter Problem
The original RunDaemon executed two HTTP requests every second:
Even when there are no new log lines and the state hasn’t changed, requests are still sent. 600 running tasks (200 runners × 3 tasks) produce 1,200 req/s.
But CI task log output is intermittent: heavy output during npm install, occasional lines while downloading Docker images, and complete silence between steps. A fixed 1-second interval wastes during silent periods and can’t go faster during bursts.
Design: Triple-Trigger Mechanism
Replace the recursive timer with a goroutine + select event loop:
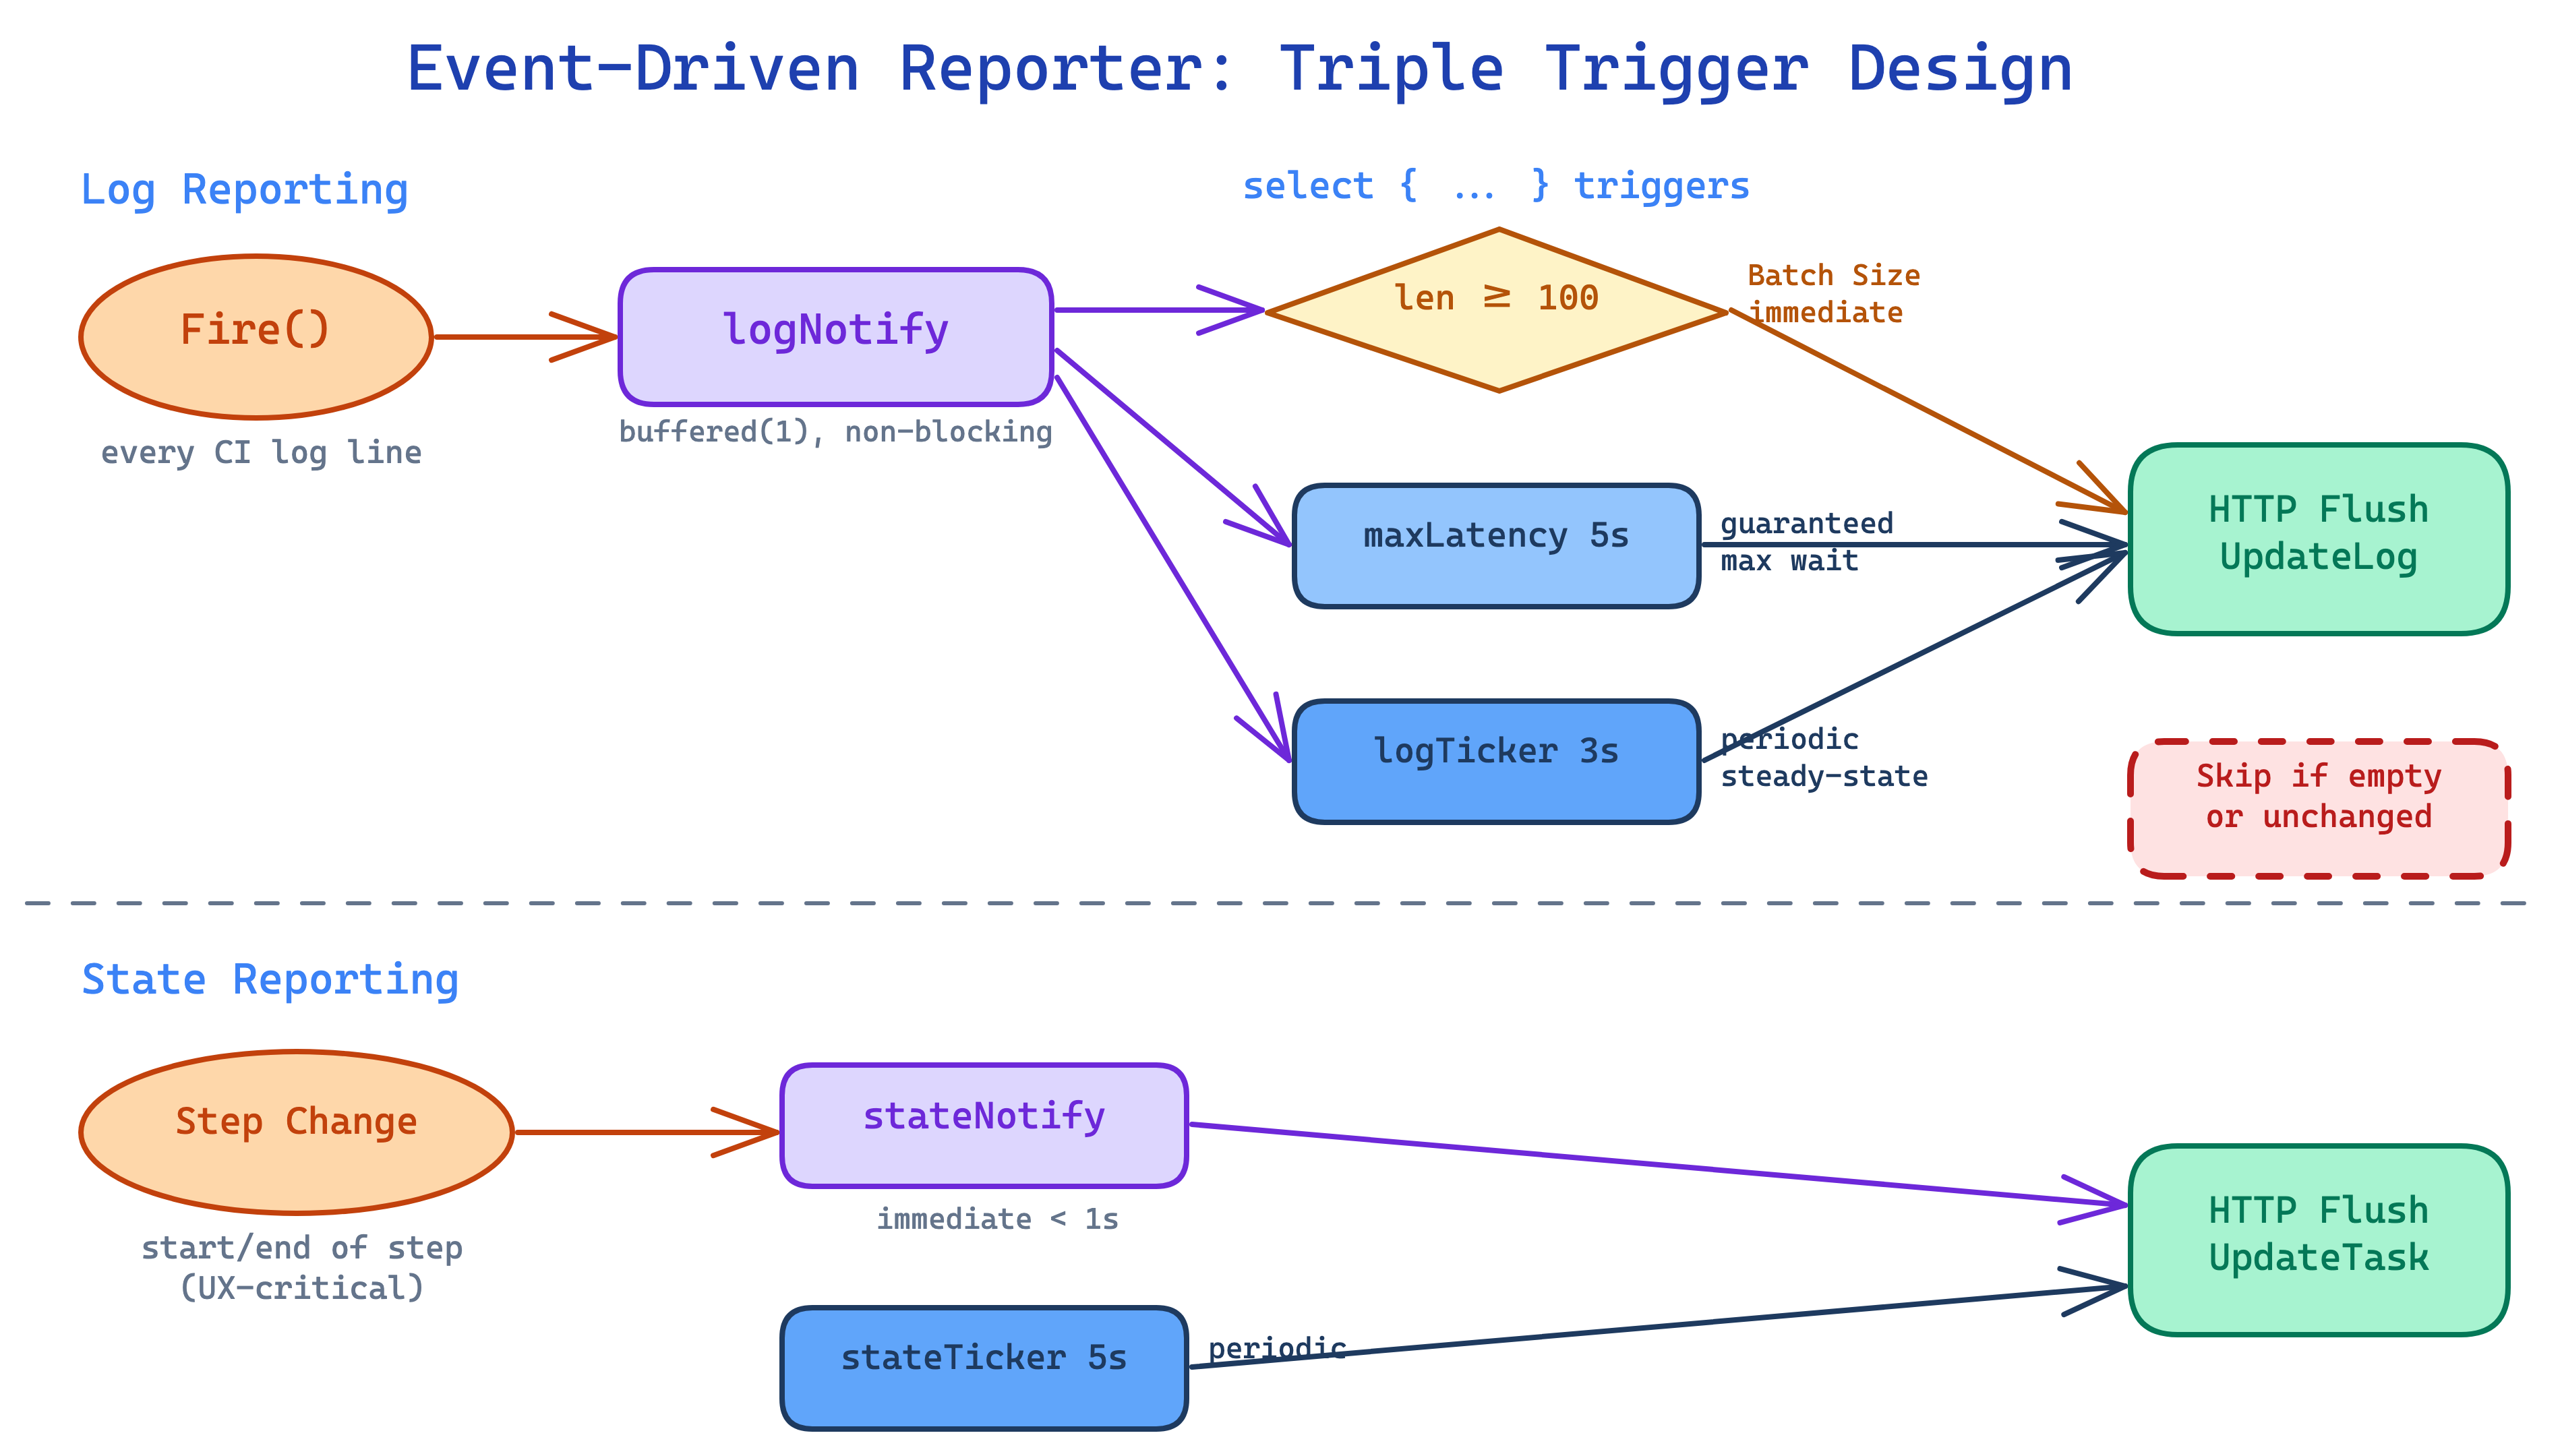
The three trigger conditions each solve a different problem:
| Trigger | Default | What it solves | What happens without it |
|---|---|---|---|
| Batch size | 100 rows | Fast delivery during high output | npm install outputs 500 lines, waits 5 seconds |
| logTicker | 5s | Steady-state baseline | Channel notifications may be coalesced, needs periodic scan |
| maxLatencyTimer | 3s | Single log line doesn’t wait long | One “Starting…” line followed by silence, waits 5 seconds |
State reporting is separated to a 5-second interval, with a stateNotify channel for immediate flushing on step transitions.
Why Separate Log and State?
Log and State have completely different change frequencies:
| Data | Change frequency | Frontend use | Latency tolerance |
|---|---|---|---|
| Log rows | Tens of lines/sec (burst) | Real-time CI output | 3-5 seconds |
| Task state | Once per step transition | Step status icons | <1s (via stateNotify) |
Sharing the same timer would force the interval to the strictest requirement, needlessly increasing the state request frequency.
Channel Design: Why Buffered(1) + Non-Blocking?
Fire() is a logrus hook — every CI log line passes through it, making it a hot path. With an unbuffered channel, Fire() would block until the daemon goroutine reads, directly slowing down CI execution.
The buffer=1 semantics mean “there’s something new” (boolean signal), not “how many.” The daemon checks len(r.logRows) after receiving the notification to learn the actual count. buffer>1 provides no additional benefit.
stateNotify: Why Flush Immediately on Step Transitions?
| |
When users watch a CI build in the Gitea UI, what they care about most is when a step changes from “waiting” to “running” (spinning animation) and from “running” to “success/failure” (checkmark/cross). These are UX-critical moments. If they have to wait 5 seconds for the stateTicker, users will feel like it’s “stuck.”
When the daemon receives a stateNotify, it flushes both log and state simultaneously, ensuring <1 second latency.
Skip Optimization: Don’t Send If Nothing Changed
Beyond the trigger mechanism, two layers of skip logic were added:
ReportLog — return immediately on empty buffer:
ReportState — dirty flag:
Why use a dirty flag instead of serialization comparison (proto.Marshal → bytes.Equal)? Because proto.Marshal would serialize the entire TaskState on every daemon tick, even though nothing changes most of the time. A dirty flag is a zero-cost bool check.
Reporter Results
| Scenario | Before | After | Reduction |
|---|---|---|---|
| Log requests (420 active tasks) | 420 req/s | 84 req/s | 80% |
| State requests | 126 req/s | 25 req/s | 80% |
| Total | ~550 req/s | ~109 req/s | 80% |
Solution 3: HTTP Client Tuning
The HTTP Client Problem
The original code used http.DefaultClient in non-insecure mode:
| |
http.DefaultClient’s MaxIdleConnsPerHost defaults to 2. All Runner requests target the same Server, and when concurrent goroutines (polling + multiple task reporters) exceed 2, excess idle connections are closed, requiring new TCP + TLS handshakes for subsequent requests.
Additionally, getHTTPClient was called twice (PingService + RunnerService), creating two separate connection pools.
The Fix
| |
Why 10? Maximum concurrency ≈ 1 (polling) + capacity × 2 (log + state per task). With the default capacity=1, only 3 are needed; setting 10 covers capacity=4 without waste.
Follow-up: Single Poller with Semaphore (PR #822)
Shortly after the per-worker design from #819 merged, @ChristopherHX pointed out during review that it had silently removed a cross-worker property of the old code. The follow-up PR #822 fixes that regression structurally.
The overlooked detail: rate.Limiter was actually shared
The old code was:
With burst=1 and a single limiter shared across all N goroutines, FetchTask calls were effectively serialized — even with capacity=60, the Runner still issued “1 FetchTask / FetchInterval” in total.
When #819 replaced the shared limiter with per-worker independent counters, that implicit cross-worker serialization disappeared. A capacity=60 Runner became “60 independent polling goroutines”, each with its own backoff and jitter — from the Server’s point of view, 60× the FetchTask traffic.
Real-world impact: 3 Runners × capacity=60
The author’s production environment runs 3 Runners with capacity=60 each:
| Metric | Pre-#819 (shared rate.Limiter) | Post-#819 (per-worker, original article) | Post-#822 (single poller + semaphore) |
|---|---|---|---|
| Polling goroutines (total) | 3 | 180 | 3 |
| Idle FetchTask RPC / cycle | 3 | 180 | 3 |
| Full-load FetchTask RPC / cycle | 180 (all wasted) | 180 (all wasted) | 0 (blocked on semaphore) |
| Concurrent connections to Server | 3 | 180 | 3 |
The “0 RPCs at full load” row is the interesting one: neither pre-#819 nor post-#819 achieves this — rate.Limiter has no notion of available capacity, so idle goroutines keep pulling tokens to issue FetchTask even when every slot is already running a task. The semaphore ties polling to capacity, eliminating that waste entirely.
Why not just revert to rate.Limiter?
The first instinct is “just put the shared limiter back”. The review discussion concluded this is not the right fix:
rate.Limiterhas no capacity notion. At full load it still hands out tokens and issuesFetchTaskRPCs that can’t be acted on — wasted RPCs that even pre-#819 code had. The semaphore blocks polling in that case, zero waste.- It composes poorly with #819’s adaptive backoff. A shared limiter wants to pin the rate to a constant; per-worker backoff wants to adjust dynamically. Layering them makes the behavior hard to reason about.
- N goroutines queueing on a shared limiter is pointless. If the cross-worker behavior is serialized anyway, a single poller expresses that directly, instead of having N-1 goroutines whose only job is to wait in line.
The new architecture: make(chan struct{}, capacity) as a semaphore
The core loop is a single goroutine:
| |
The exponential backoff and jitter described earlier in this article are fully preserved — they just run against a single workerState instead of N.
Capacity now has a precise structural meaning under this design: “number of slots”. The invariant acquire slot → fetch → dispatch → release implies, by construction, that polling can never outpace capacity.
Incidentally fixing a pre-existing Shutdown bug
Shutdown() previously looked like this:
<-p.done blocks until the channel is closed, so the timeout path that was supposed to force-cancel running jobs via shutdownJobs() was actually dead code. Turning it into a real non-blocking check fixes that:
This bug is unrelated to the polling architecture, but since the Poller was being rewritten anyway, the fix rode along in the same PR.
No config changes required
capacity / fetch_interval / fetch_interval_max and all the other settings keep their semantics — no config changes required. The only difference is the implementation underneath: N polling goroutines → 1 poller + semaphore.
Difference from Circuit Breakers
Some might ask: isn’t this just a circuit breaker? Not exactly.
| Dimension | Circuit Breaker | Our Adaptive Backoff |
|---|---|---|
| Stops requests? | Yes (fully blocks in OPEN state) | No, just slows down (60s max) |
| State model | Three states: Closed → Open → Half-Open | Stateless, continuous interval calculation |
| Recovery method | Probes one request after cooldown | Resets immediately when task acquired |
| Design purpose | Fail-fast | Reduce wasted load |
Circuit breakers are suited for scenarios where “the downstream is completely unavailable and continuing to retry only adds burden.” Our scenario is “the downstream is fine, there’s just no work to do” — Backoff is more appropriate. If we need to protect against Server overload in the future, we can layer a circuit breaker on top when consecutiveErrors exceeds a threshold.
Frontend UX Impact
None of these optimizations should sacrifice user experience. Here’s the latency comparison:
| Scenario | Before | After | Why it’s acceptable |
|---|---|---|---|
| Continuous output (npm install) | ~1s | ~5s | CI logs don’t need sub-second updates |
| Single line then silence | ~1s | ≤3s | maxLatencyTimer as baseline |
| Large burst (100+ lines) | ~1s | <1s | Batch size triggers immediate flush, faster than before |
| Step start/end | ~1s | <1s | stateNotify immediate flush |
| Job completion | ~1s | ~1s | Close() retry mechanism unchanged |
New Configuration Options
All settings have safe defaults — existing configuration files require no changes:
| |
Summary
| Optimization | Approach | Reduction |
|---|---|---|
| Polling | Exponential backoff + jitter | 97% (idle runners) |
| Log reporting | Event-driven + batching + skip empty | 80% |
| State reporting | Separate interval + dirty flag + skip unchanged | 80% |
| HTTP connections | Connection pool tuning + shared client | Reduced TCP/TLS re-establishment |
| Overall | 200 runners × 3 tasks | 1,300 → 170 req/s (87%) |
The common principle behind all these optimizations: don’t do unnecessary work. No new logs? Don’t send UpdateLog. State unchanged? Don’t send UpdateTask. No jobs? Gradually reduce FetchTask frequency. By significantly reducing Server load without sacrificing frontend responsiveness.
One more direction, raised by @silverwind in the #819 discussion: replace HTTP polling with a persistent socket (e.g. WebSocket). That would make this entire class of “lots of requests just to ask whether anything new happened” go away at the architectural level. It’s a larger change that touches both Server and Runner, so this series of PRs chose to first squeeze wasted requests out of the existing HTTP-polling model — but a socket-based protocol remains a worthwhile longer-term investment.